Operations Management
Understanding your data
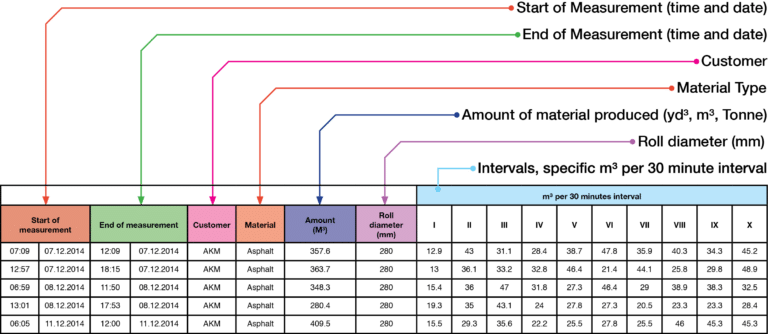
How does this data affect my operation?
Your Sensortechnik data provides you with an in-depth quantifiable performance metric which you can use to power business and operation decisions. Know exactly how much material your crew and equipment are processing daily.
By having the ability to monitor production, you can spot operations issues before they cost you money. Unexpected periods of downtime may be a sign of fundamental problems, such as:
- Unsuitable machines for loading or preliminary work
- Non-matching capacities of the equipment
- Inability to meet your customer production demands
Paying workers during downtimes or overtime will increase your operational expenses significantly. But with the Sensortechnik Optical Belt Scale, your production processes can be consistently analyzed to detect problems before they lead to costly downtime.
As you build your database of measurements over time, you will be able to spot performance trends in your data, and even catch wear part replacements before they disrupt your operation. Data and metrics provide a solid operational foundation which empowers your decision making and business profitability.
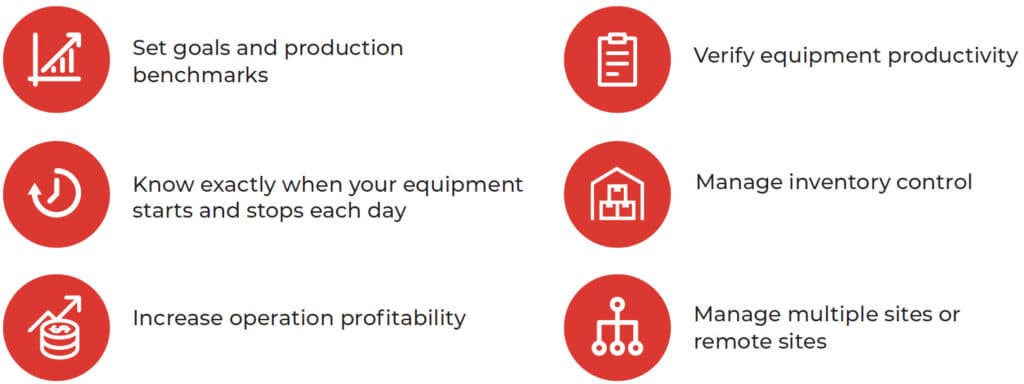
Operational Benefits